Advanced Freight Analytics
Using Spire Maritime Data
Welcome to the Darling Analytics email subscription, where we share information about our services and answer industry-related questions using our AI Machine Learning tools.
If you do not wish to receive these emails, please opt-out by clicking “unsubscribe” at the bottom of this email.
Custom Freight Analytics BI & The Impact of Route Switching
When studying what impacts arbitrage and freight volatility, flow cargo data is only half the story. An often-overlooked metric that is arguably more important than flow cargo data is the freight in-ballast to new routes. This is one of the main contributing factors to arbitrage and freight volatility.
The only way to evaluate the impact of these changes is to have an understanding of mean freight densities on those routes: how they change over time, and how freight is being directed on these routes.
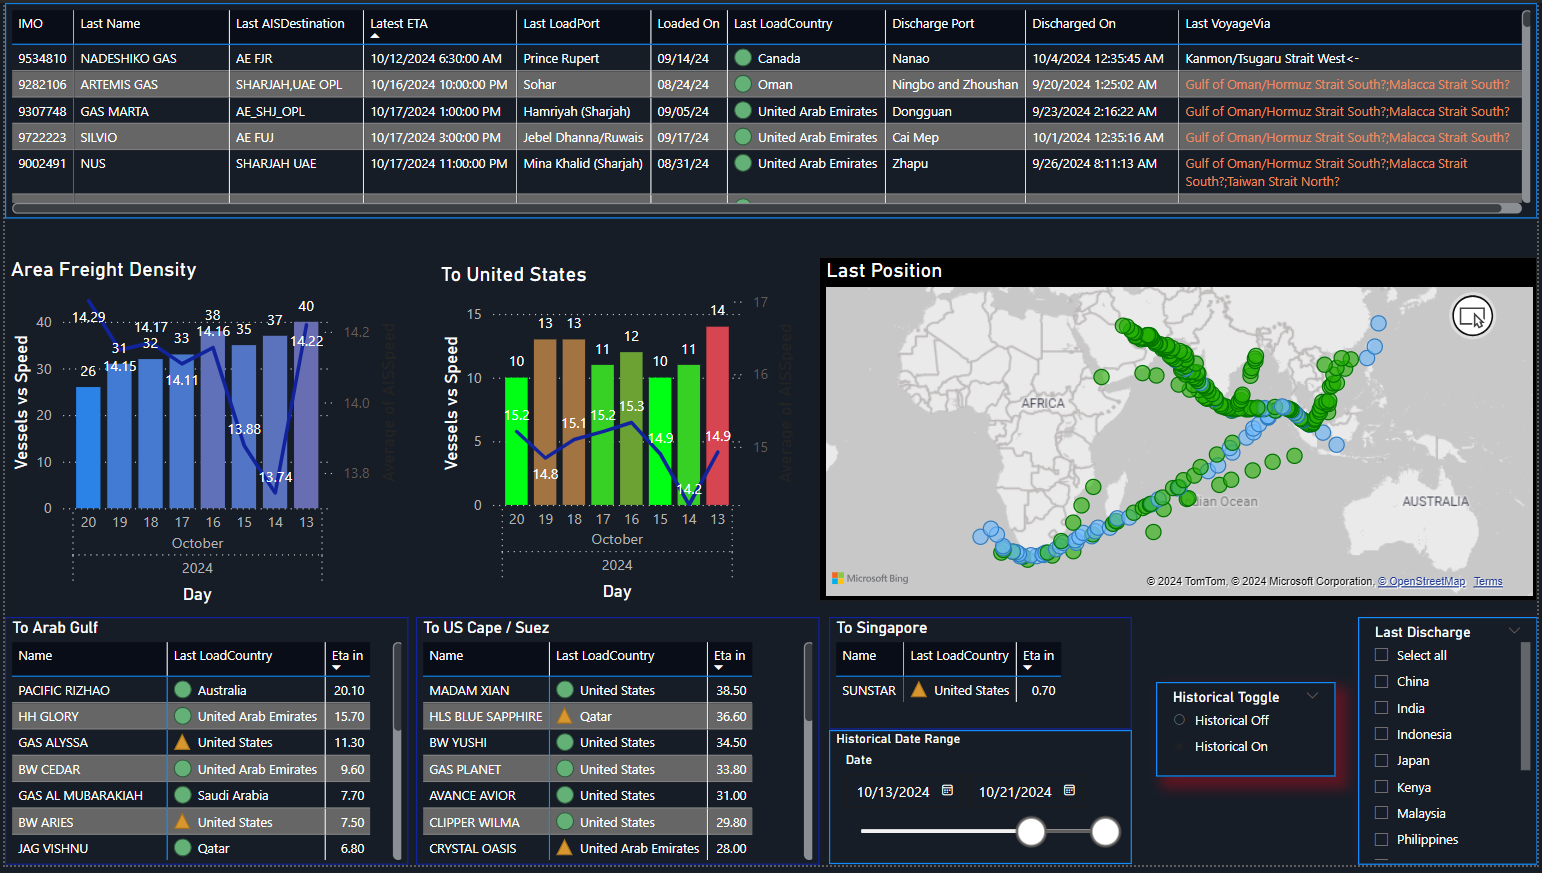
With our advanced algorithms you can easily monitor real-time vessels & route switching as well as historical freight densities. Our fully customizable BI dashboards are tailored to your business needs to include your in-house freight intelligence and preferred flows data supplier.
This sophisticated dashboard will not only provide you with a statistical advantage for freight and arbitrage trading but will help you understand & manage your maritime data like never before.
Maritime Analytics: Key Insights
- Real-time vessel satellite data including speed & location.
- Load vs ballast analytics.
- Area freight density analytics.
- Vessel route diversions.
- Historical data.
- Fully customizable with your own freight intelligence & preferred flows data supplier.
Just Ask Darling.
*Ping data enriched with LSEG Commodity Flows.
A taste of our newsletter updates


Making Every Trade a Smart Trade


Sandy Port
New Providence, New Providence,
NASSAU,
P.O Box: N-4825,
Bahamas
