EIA Weekly Crude Oil 4-Week Forecast
With Darling you can explore any EIA data, Monthlies, Weeklys and STEO forecasts to get unprecedented analysis of any table in minutes. Not only that but you can combine these studies with any other structured data set you want.
Today we ask Darling to take the EIA weeklys, do a 5 year study and provide a 4 week forecast. With Darling you can get insights on any EIA table in minutes and get insights you never thought possible.
Ask Darling
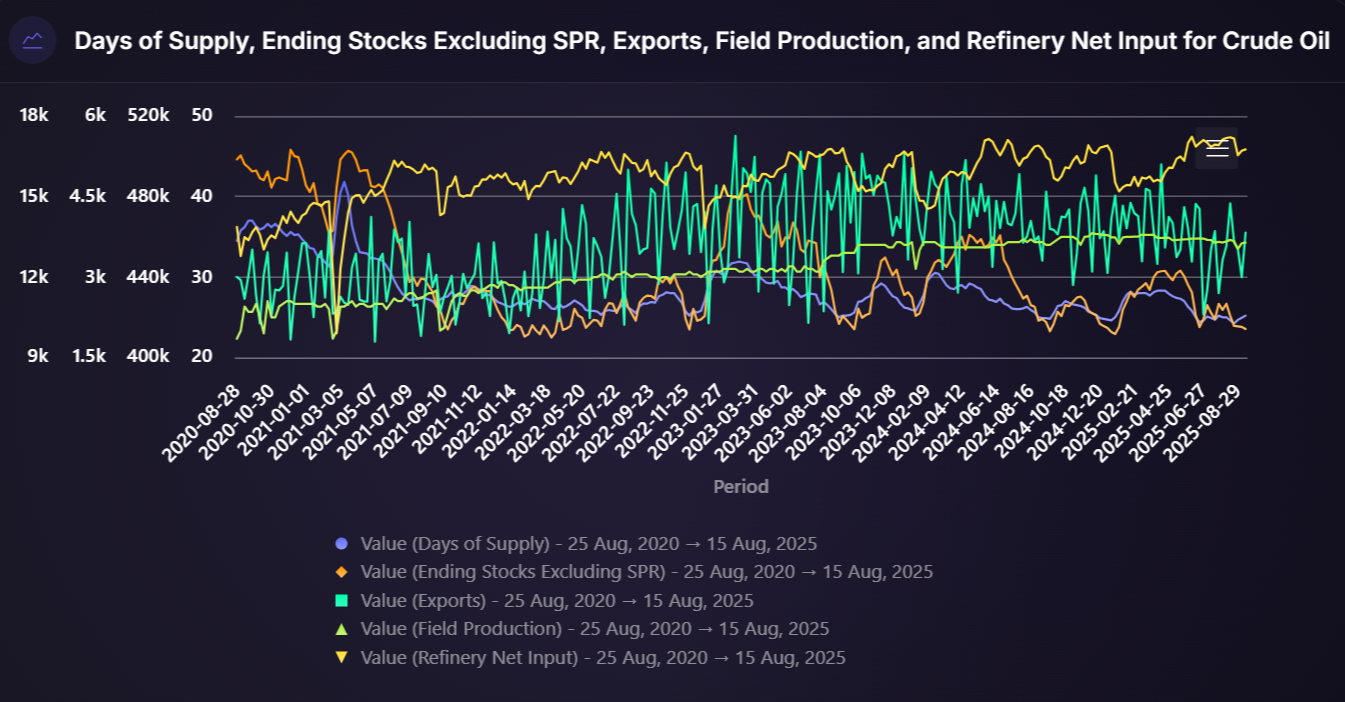
"Take all the EIA weeklys for the last 5 years for Crude Oil and do a deep dive on Days of Supply, Ending Stocks Excluding SPR, Exports, Field Production, Refinery Net Input. Do a forecast for each for the next 4 weeks. Maintain YTD trends and historical seasonality and consistency."
Summary Insights: U.S. Crude Market: Record Tight Fundamentals vs. Weak Pricing
- Supply crunch: Days of Supply at 24.6 (below 5yr min) | Stocks at 420.7M bbl (5yr low) → tightest market in years
- Demand surge: Exports 4.37M bbl/d (record high, +22% WoW) | Refinery runs 17.2M bbl/d (5yr peak) → exceptional offtake
- Production maxed: Field output 13.38M bbl/d near capacity ceiling → can't meet demand surge
- 4wk outlook: Continued drawdowns expected across all metrics → fundamentals stay tight
- Price paradox: WTI $63.87 (-17.5% YoY) despite record-tight U.S. fundamentals → global headwinds override domestic strength
Darling’s Insights
Looking at this analysis, I need to examine the comprehensive EIA weekly data analysis that was performed, covering the last 5 years of crude oil supply estimates from August 25, 2020, to August 15, 2025. The analysis successfully retrieved 4,680 records across the five requested metrics.
Data Quality and Coverage
The SQL query successfully captured all requested processes: Days of Supply, Ending Stocks Excluding SPR, Exports, Field Production, and Refinery Net Input. The dataset shows proper geographic coverage with 8 unique areas, with the U.S. being the primary focus (1,300 records). The data includes appropriate units: MBBL/D for flow metrics, MBBL for stocks, and DAYS for supply duration.
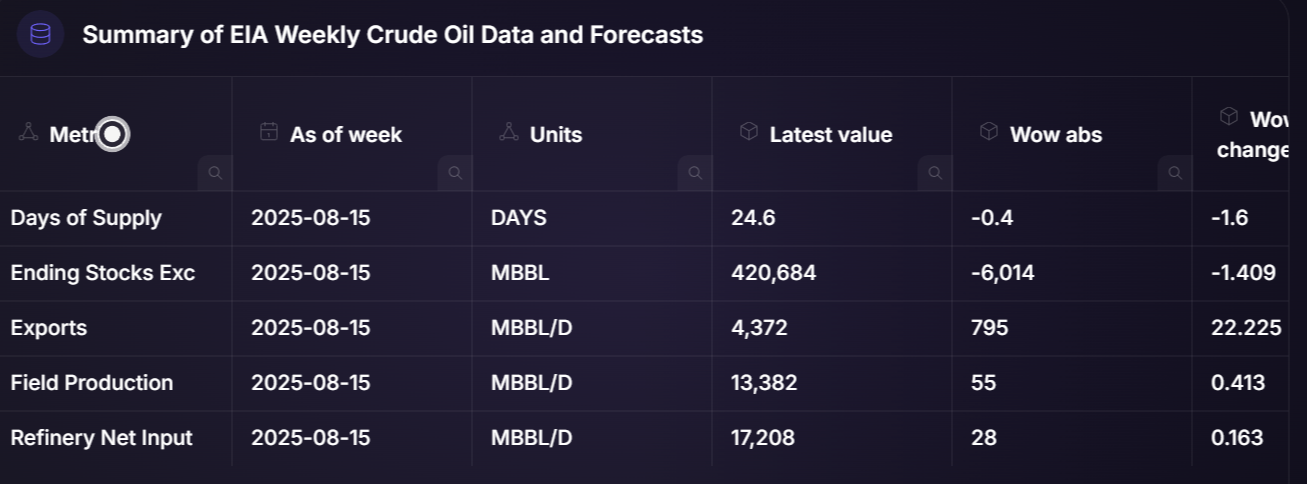
Current Market Conditions (Week Ending August 15, 2025)
The analysis reveals an extremely tight U.S. crude oil market:
Supply Tightness Indicators:
- Days of Supply: 24.6 days, below the 5-year minimum of 25.9 days for this week
- Ending Stocks Excluding SPR: 420,684 MBBL, below the 5-year minimum of 421,672 MBBL
- Both metrics show consistent drawdowns (WoW: -1.6% and -1.4% respectively)
Demand Strength:
- Exports: 4,372 MBBL/D, exceeding the 5-year maximum of 4,258 MBBL/D with a massive 22.2% WoW spike
- Refinery Net Input: 17,208 MBBL/D, surpassing the 5-year maximum of 16,776 MBBL/D
- Field Production: 13,382 MBBL/D, near peak capacity at the top of its 5-year range
Four-Week Forecast
The forecast indicates continuation of current tight market conditions:
- Days of Supply expected to decline further
- Ending Stocks to continue drawdown trend
- Exports to moderate but remain historically strong
- Field Production to stay flat near peak levels
- Refinery inputs to maintain robust levels
External Market Context
From web search results, current market prices reflect some of this tightness but also show broader market pressures. WTI crude is trading at $63.87/barrel and Brent at $67.93/barrel as of August 25, 2025.
However, both are down significantly year-over-year (WTI -17.50%, Brent -16.58%), suggesting that despite tight U.S. fundamentals, global factors including economic concerns and geopolitical developments have weighed on prices.
The analysis shows a clear disconnect between strong U.S. fundamentals (record exports, record refinery runs, minimal inventories) and weaker global pricing, which could indicate either global oversupply or demand concerns outside the U.S. market.
A taste of our newsletter updates


Making Every Trade a Smart Trade


Sandy Port
New Providence, New Providence,
NASSAU,
P.O Box: N-4825,
Bahamas
